import io.data2viz.axis.Orient
import io.data2viz.axis.axis
import io.data2viz.color.Colors
import io.data2viz.color.Color
import io.data2viz.geom.Size
import io.data2viz.geom.size
import io.data2viz.scale.Scales
import io.data2viz.viz.*
import kotlin.browser.document
import kotlin.browser.window
import org.w3c.dom.HTMLCanvasElement
import kotlin.math.cos
import kotlin.math.max
import kotlin.math.sin
import kotlin.properties.Delegates.observable
import io.data2viz.timer.timer
data class Range(val min: Double, val max: Double)
fun range(min: Double, max: Double) = Range(min, max)
class Plot(
val points: MutableList<Double> = mutableListOf(),
val stroke: Color = Colors.Web.steelblue,
val strokeWidth: Double = 1.5
)
class LinePlotter(val size: Size, val plots: List<Plot>) {
val labels: MutableList<Double> = mutableListOf<Double>()
// TODO make margins and size mutable
// TODO checks that margins aren't bigger than size
val margins = Margins(40.5, 30.5, 50.5, 50.5)
val chartWidth = size.width - margins.hMargins
val chartHeight = size.height - margins.vMargins
var xRange: Range by observable(
range(labels.firstOrNull() ?: 0.0, labels.lastOrNull() ?: 0.0)
) { _, old, new -> if (old != new) xScale = newXScale() }
var yRange: Range by observable(
range(
plots.mapNotNull { it.points.min() }.min() ?: 0.0 ,
plots.mapNotNull { it.points.max() }.max() ?: 0.0
)
)
{ _, old, new -> if (old != new) yScale = newYScale() }
// linear scale for x
private var xScale = newXScale()
private fun newXScale() = Scales.Continuous.linear {
domain = listOf(xRange.min, xRange.max)
range = listOf(.0, chartWidth)
}
// linear scale for y
private var yScale = newYScale()
private fun newYScale() = Scales.Continuous.linear {
domain = listOf(yRange.min, yRange.max)
range = listOf(chartHeight, 0.0) // <- y is mapped in the reverse order (in SVG, javafx (0,0) is top left.
}
private fun GroupNode.xAxis() = group {
transform { translate(y = chartHeight + 10) }
axis(Orient.BOTTOM, xScale)
}
private fun GroupNode.yAxis() = group {
transform { translate(x = -10.0) }
axis(Orient.LEFT, yScale)
}
private var redraw: Boolean = false
private fun Viz.build() {
group {
transform {
translate(x = margins.left, y = margins.top)
}
group { yAxis() }
group { xAxis() }
group {
plots.forEach { plot ->
group {
path {
fill = null
stroke = plot.stroke
strokeWidth = plot.strokeWidth
if (labels.isNotEmpty()) {
moveTo(xScale(labels[0]), yScale(plot.points[0]))
for (i in 1 until labels.size) {
lineTo(xScale(labels[i]), yScale(plot.points[i]))
}
}
}
}
}
}
}
}
val visual: Viz = viz {
size = this@LinePlotter.size
build()
}
init {
visual.animation { time ->
// update at most 25 frame per second
if (time >= 40.0) {
if (redraw) {
visual.clear()
visual.build()
redraw = false
}
}
}
}
fun invalidate() {
redraw = true
}
fun push(x: Double, ys: List<Double>) {
labels.add(x)
// updates xRange
xRange = xRange.copy(max = max(xRange.max, x))
var newMin = yRange.min
var newMax = yRange.max
for (i in plots.indices) {
val y = ys[i]
plots[i].points.add(y)
if (y < newMin) newMin = y
if (y > newMax) newMax = y
}
// update yRange
yRange = range(newMin, newMax)
invalidate()
}
}
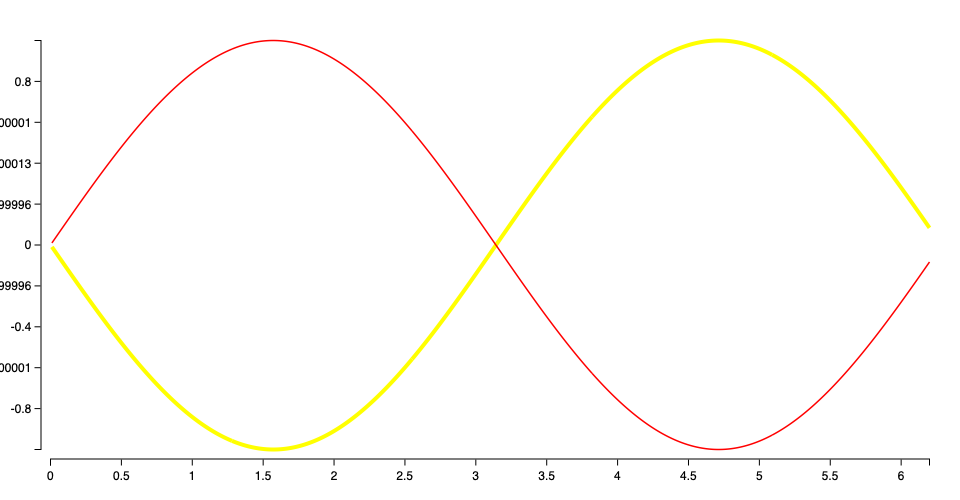
fun main() {
val plots = listOf(
Plot(stroke = Colors.Web.yellow, strokeWidth = 4.0),
Plot(stroke = Colors.Web.red)
)
val plotter = LinePlotter(size(960.0, 500.0), plots)
plotter.visual.bindRendererOnNewCanvas()
var current = 0.0
val step = 1.0 / 100.0
timer(200.0) {
repeat(20) {
plotter.push(current, listOf(cos(current+3.14/2.0), sin(current)))
current += step
}
}
}