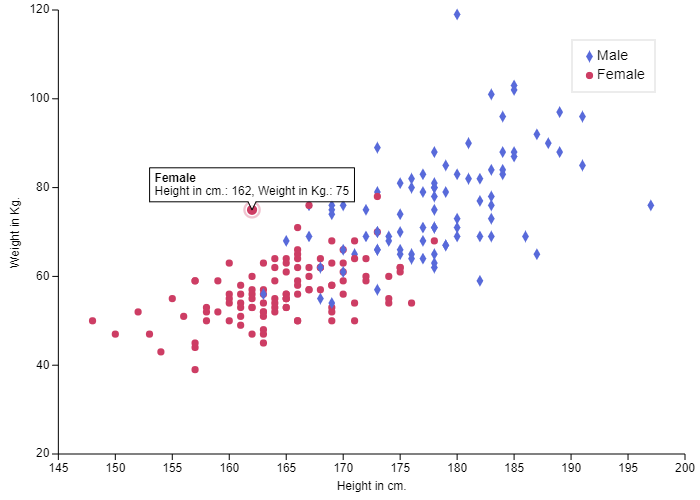
Multi-series scatter plot
a sketch by
Pierre Mariac
Snapshot
Settings
Save
View
Editor
Details
Sign up
Log in
import io.data2viz.charts.* import io.data2viz.charts.core.* import io.data2viz.charts.dimension.* import io.data2viz.charts.chart.* import io.data2viz.charts.chart.mark.* import io.data2viz.charts.viz.* import io.data2viz.charts.layout.* import io.data2viz.geom.* import io.data2viz.math.* import io.data2viz.shape.* import io.data2viz.color.* import io.data2viz.dsv.Dsv import org.w3c.fetch.Response import kotlinx.browser.window import kotlin.js.Promise val width = 700.0 val height = 500.0 enum class Gender { M, F; override fun toString() = when (this) { M -> "Male" F -> "Female" } } data class Record(val gender: Gender, val weight: Double, val height: Double) private fun parseRecord(row: List<String>) = Record(Gender.valueOf(row[1]), row[2].toDouble(), row[3].toDouble()) fun main() { // Creating and sizing the VizContainer val vc = newVizContainer().apply { size = Size(width, height) } // source file: https://docs.google.com/spreadsheets/d/1Wt7q_FbCPWlqZRKi-bfLOZ9n3kkpiFVmAILbfW3j2Fo/edit?usp=sharing // original taken from https://vincentarelbundock.github.io/Rdatasets/ val request: Promise<Response> = window.fetch("https://docs.google.com/spreadsheets/d/e/2PACX-1vQ5LlZO-99COmRqJwKh3u_r3gLA1LS8QIljOOuwkHO2hJmwiKWBR7LNT7wntEuO93DKQHsP8m--OEvb/pub?gid=2124041701&single=true&output=csv") request.then { it.text().then { val results = Dsv() .parseRows(it) .drop(1) .map { parseRecord(it) } .filter { it.weight < 165 } // remove an outer value vc.chart(results) { config { legend { show = LegendVisibility.Show } } // Create 2 continuous numeric dimensions val weight = quantitative( { domain.weight } ) { name = "Weight in Kg." } val height = quantitative( { domain.height } ) { name = "Height in cm." } // Split our dataset in 2 series based on gender series = discrete( { domain.gender } ) // Plot values plot(height, weight) { strokeColor = discrete( { config.mark.strokeColors[indexOfSeries] } ) marker = discrete( { if (domain.gender == Gender.M) Symbols.Diamond else Symbols.Circle } ) size = constant(40.0) } } } } }
Sketch Settings
Sketch description
Very simple dual series scatter plot made with Charts-kt. The dataset comes from a Google spreadsheet: https://docs.google.com/spreadsheets/d/1Wt7q_FbCPWlqZRKi-bfLOZ9n3kkpiFVmAILbfW3j2Fo/edit?usp=sharing
Sketch Thumbnail
Sketch DELETE
DELETE CURRENT SKETCH