import io.data2viz.charts.*
import io.data2viz.charts.core.*
import io.data2viz.charts.dimension.*
import io.data2viz.charts.chart.*
import io.data2viz.charts.chart.mark.*
import io.data2viz.charts.viz.*
import io.data2viz.charts.layout.*
import io.data2viz.geom.*
import io.data2viz.color.*
import io.data2viz.timeFormat.*
import io.data2viz.dsv.Dsv
import org.w3c.fetch.Response
import kotlinx.browser.window
import kotlin.js.Promise
import kotlinx.datetime.*
val width = 700.0
val height = 500.0
// data class used to store stock prices
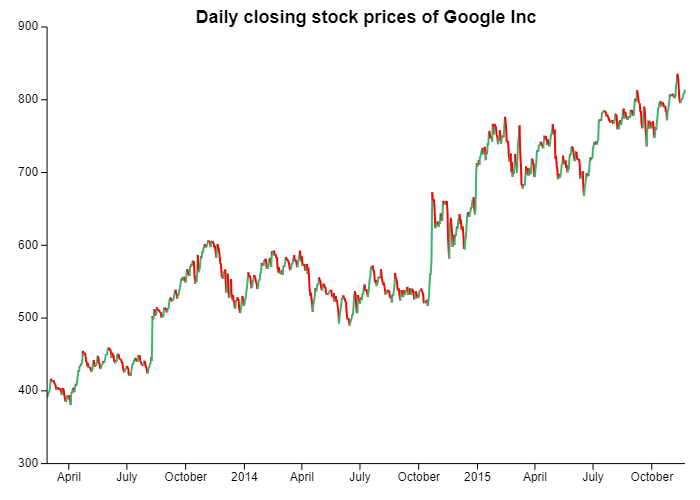
data class Stock(val date: Instant, val closingPrice: Double)
// Closing stock prices of GOOG from the NASDAQ exchange,
// for 1000 consecutive trading days since 25 February 2013.
private val startDate: Long = parse("%x")("2/25/2013")?.toEpochMilliseconds() ?: 0
private fun parseStocks(row: List<String>) = Stock(Instant.fromEpochMilliseconds(startDate + (row[1].toInt() * 8.64e+7).toLong()) , row[2].toDouble())
fun main() {
// Creating and sizing the VizContainer
val vc = newVizContainer().apply {
size = Size(width, height)
}
// source file: https://docs.google.com/spreadsheets/d/1puxuJNfA9McVGf-E6amoY4DNLqFaFQyc7YiVt77J4uw/edit?usp=sharing
// original taken from https://vincentarelbundock.github.io/Rdatasets/
val request: Promise<Response> =
window.fetch("https://docs.google.com/spreadsheets/d/e/2PACX-1vSE8Potwoy4ZM54CgB5YpdS6LUBxP2rU2oa2S52tigcNJgY9nTKiXfK0m4qh1T2xOfm3Qq_COfqXYDF/pub?gid=218975680&single=true&output=csv")
request.then {
it.text().then {
val closingPrices = Dsv()
.parseRows(it)
.drop(1)
.map { parseStocks(it) }
vc.chart(closingPrices) {
title = "Daily closing stock prices of Google Inc"
config {
cursor {
show = true
type = CursorType.Crosshair
}
events {
triggerMode = TriggerMode.Column
zoomMode = ZoomMode.X
panMode = PanMode.X
}
}
// The X-axis is a "temporal", a continuous dimension that manages time
val day = temporal( { domain.date } )
val closingPrice = quantitative( { domain.closingPrice } )
// Plot values
line(day, closingPrice) {
// Draw a green line if stock price closes higher than previous day
// Else draw a red line
strokeColor = discrete( {
if (closingPrices.getOrNull(indexInData + 1)?.closingPrice ?: Double.NEGATIVE_INFINITY > domain.closingPrice) Colors.Web.mediumseagreen
else Colors.Web.red
} )
strokeWidth = constant(2.0)
// Set some limits, to disable zoom out (or pan out) out of these values
x {
min = closingPrices.first().date
max = closingPrices.last().date
}
}
}
}
}
}