Data2viz .play
Explore
Sketches
Create
Sketch
Documentation
Let's startCore mechanismsColors and gradientsScalesChromatic ScalesForcesRandom numbers
Sign upLog in

Sketches with tag Charts.kt

pierre avatar

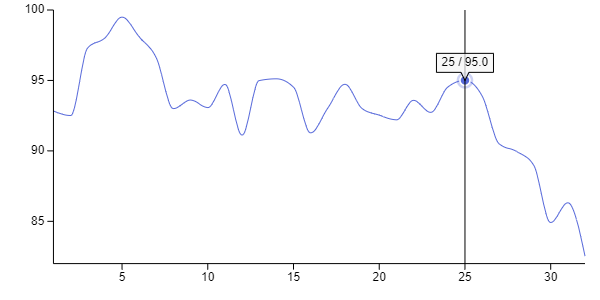
How-to Synchronize 2 charts

pierre

 3324 
 0 
 1 
pierre avatar

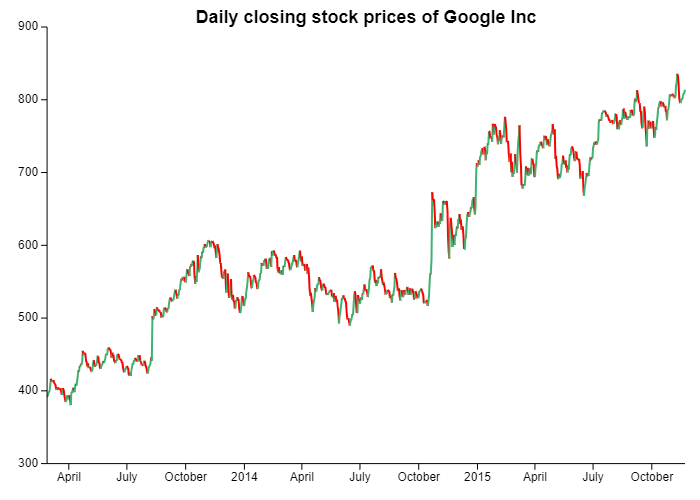
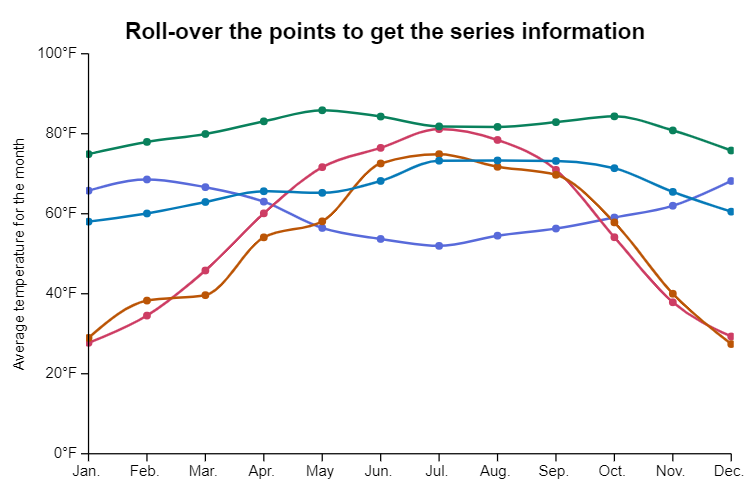
Basic line chart with temporal Axis

pierre

 4996 
 0 
 1 
pierre avatar

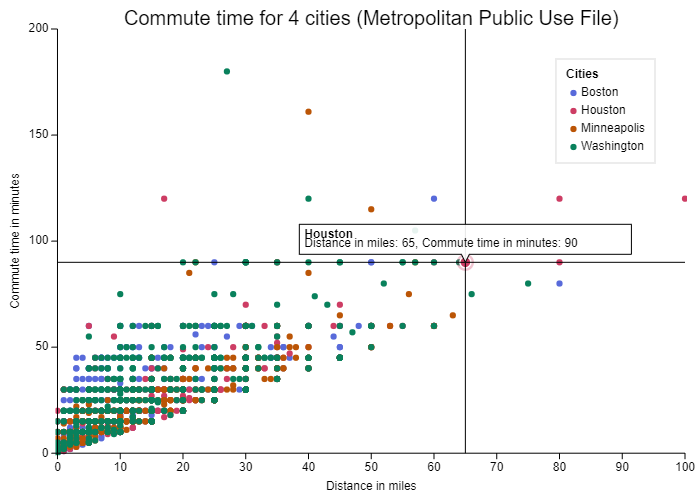
Commute time for 4 cities

pierre

 2714 
 0 
 1 
pierre avatar

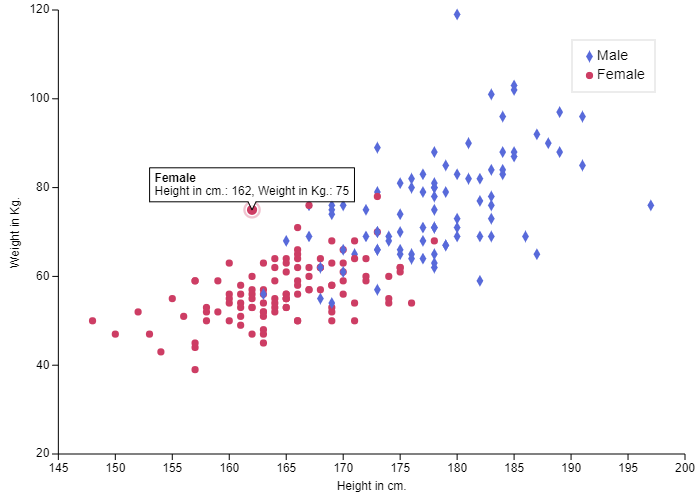
Multi-series scatter plot

pierre

 3334 
 0 
 1 
pierre avatar

Split dataset by series and access series info

pierre

 1687 
 0 
 0 
pierre avatar

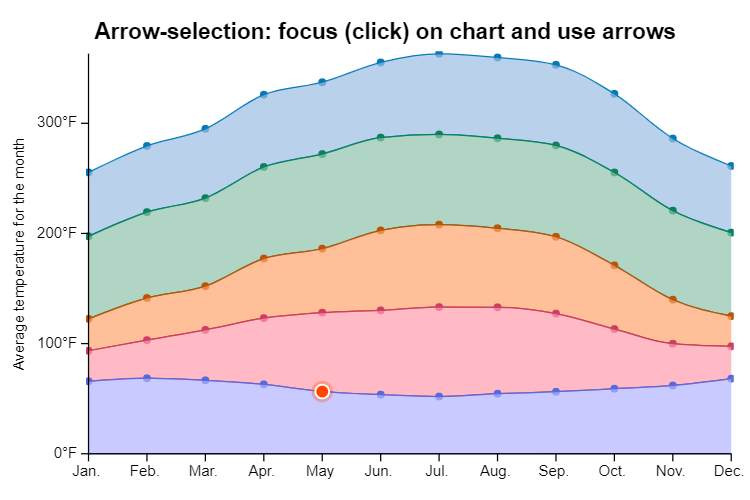
Charts: keyboard sample control

pierre

 1821 
 0 
 0 
PreviousNext page
  • 1
  • 2
  • 3
  • 4
  • …
  • 7